

Market Summary: July 2026
July 2026 was broadly a story of investor sentiment revision, with commodities and China outperforming by month’s end. Growth across developed markets continued to slow, while equity markets breached record highs only to then retreat, and central banks mulled over inflation data. Renewed tension between the US and Iran resulted in a volatile energy market, with Brent crude once again topping USD 100 per barrel.
Chinese technological advances, poor monetization, and increased leverage weighed on Western AI valuations, with the MSCI World Semiconductors Index falling 13.2% and the MSCI World Information Technology Index down 4.1%. The rotation from technology stocks drove strong returns in energy, financials, and value stocks.
Moving forward, markets remain sensitive to developments in the Middle East, inflation, and AI earnings.
US Market
Small Cap stocks continue to outperform large cap YTD, particularly small cap growth and small cap value. Value stocks rallied, as investors looked for opportunities outside of AI.
US GDP is slowing, coming in at 1.5% quarter over quarter (QoQ). According to Morningstar, US GDP is both better and worse than it may appear. When net exports and inventories are removed, GDP expanded at 3.5%. The expansion was supported by a 3.2% increase in personal consumption, despite the rise in oil prices, as well as a 6.8% acceleration in durables purchasing.
The primary component of growth was nonresidential fixed investment, increasing 8.4% QoQ. Interestingly, however, information processor spending expanded at only 8.3%, versus (vs) the 25% YoY rate of the first quarter, meaning capital spending outside of AI meaningfully rebounded in quarter 2.
Unfortunately, not all news was good. Personal savings rates are now at 2.9%, which is far below the pre-COVID level of 6.9%. Analysts anticipate an eventual reversal as consumers become over extended, reflected in an increase in US household defaults.
Annual inflation for June 2026 fell to 3.5%, a significant fall from May’s 4.2%. In the labor markets, US jobs rose slightly, evidencing stability. The Federal Open Market Committee (FOMC) kept rates unchanged at 3.5% to 3.75%, but analysts presage a rate increase either by the end of the year or by early 2027.
Europe
European equities were up slightly, as proxied by the 2.36% gain in the Vanguard FTSE Europe ETF. Seasonally adjusted Q2 GDP rose 0.4% in the euro area and 0.5% in the EU, with Ireland’s growth at 3.9% vs Lithuania’s, the second highest growth rate, at 1.7%.
Asia Pacific
In APEC, the Middle East conflict continues to drag on performance, with growth expected to moderate to 4.9%, below the 5.5% of 2025. The Asian Development Bank raised the forecast for inflation from 3.6% to 4.3%.
China reported Q2 economic growth at the slowest pace since 2022 due to consumer spending, property, and investment weakness dragging on strong export and industrial output. Analysts expected growth in the range of 4.46% to 4.6%, with the final number being reported as 4.3%. China’s economy is sharply divided between the expanding high-tech sector and rising exports on one side and underperforming property, poor consumer consumption, and a weak labor market on the other.
Emerging Markets
45% of the MSCI emerging equity index is composed of South Korea and Taiwan. Only July 31, the Kospi rose 18%, on the back of 3 consecutive days of losses that totaled nearly 18%. Moreover, the jump in oil paired with the market’s expectation of an eventual rate raise by the FOMC are fueling concerns around the current level of asset prices.
Fixed Income
In the fixed income markets, the FOMC kept rates unchanged. The war in Iran continues to pressure fixed income, with the Morningstar US Core Bond Index negative through July 31. AI corporate borrowing is beginning to saturate the bond market, though rates remain at historically tight levels. JP Morgan forecasts investment grade issuance to reach USD 1.81T in 2026, with over USD 300B directly linked to hyperscalers such as Amazon and Alphabet, representing the largest borrowing surge in history.
Many analysts are expecting credit markets to remain “higher for longer” with spread tightening remaining. As such, Morningstar sees today’s market as challenging, with duration sensitive and lower credit quality positions vulnerable to correction.
Fixed income performance in 2025 and 2026 has revealed bonds to be a robust defensive option in the portfolio. The correlation coefficient between US equities and US bonds is 0.11 over the past two years vs 0.66 in 2022. Thus, when markets have fallen on AI exits or the Iran war, bonds have provided support.
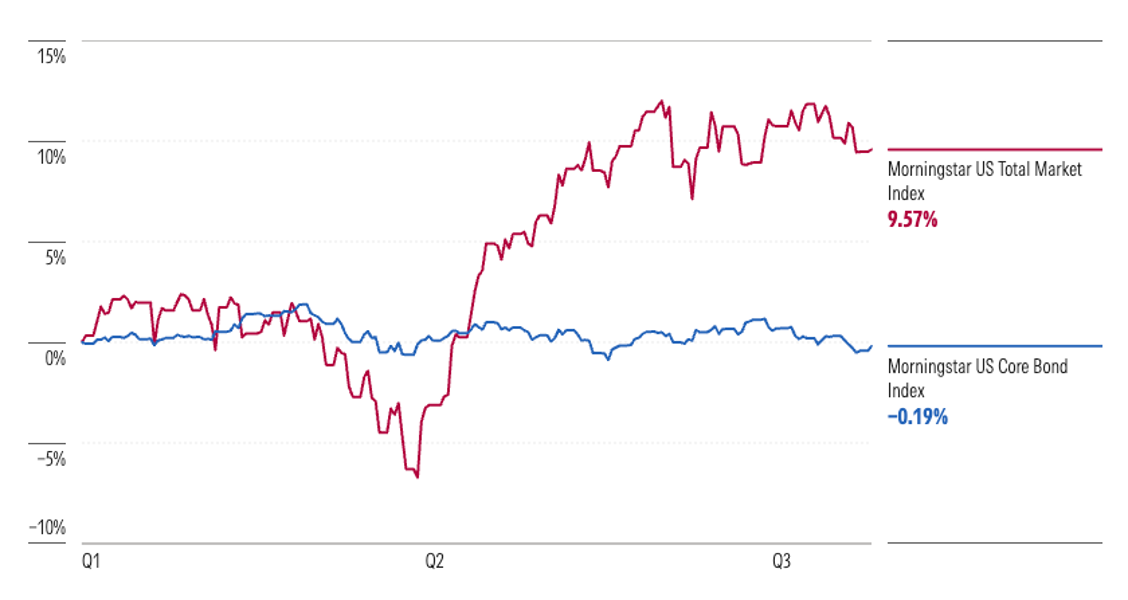
2026 TR
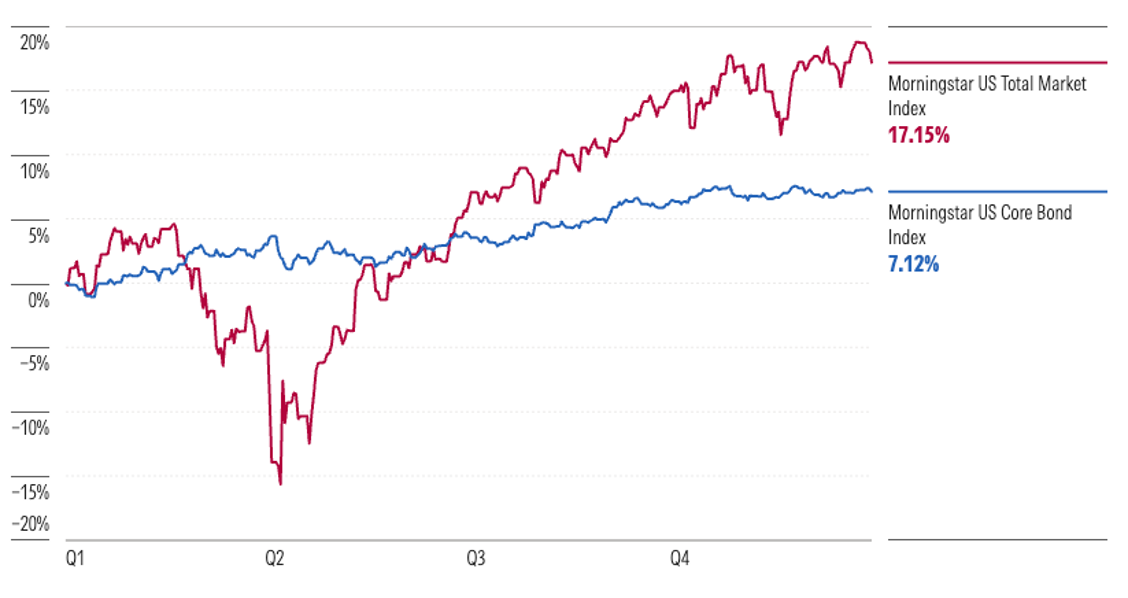 2025 TR
In Europe, sovereign bond yields rose following the European Central Bank’s (ECB’s) rate hike and upward revised inflation forecasts. Sovereign two years were tracking ahead of the deposit rate signaling the markets expectation of future rate hikes as Europe contends with the concurrent effects of inflation and greater military and infrastructure spending.
In Q2, Moody’s upgraded China’s banking sector to stable from negative, Thailand was also revised to stable from negative, while Fitch lowered the Philippines’s sovereign rating to negative.
Asset Class | ETF Name | Ticker | 1Mo Return | YTD Return | 1-Year Return |
US Market | Vanguard Total Stock Market ETF | VTI | -0.51 | 10.50 | 19.80 |
Global | Vanguard Total World Stock ETF | VT | -0.62 | 11.28 | 22.26 |
Europe | Vanguard FTSE Europe ETF | VGK | 2.36 | 10.46 | 23.72 |
Japan | iShares MSCI Japan ETF | EWJ | -1.33 | 15.09 | 31.76 |
Emerging Markets | Vanguard FTSE Emerging Markets ETF | VWO | -1.80 | 9.19 | 20.50 |
China | iShares MSCI China ETF | MCHI | 8.70 | -7.22 | -1.28 |
Asia Pacific | Vanguard FTSE Pacific ETF | VPL | -5.25 | 21.28 | 39.14 |
Commodities | USCF SummerHaven Dyn Cmdty Stgy No K-1 ETF | SDCI | 9.49 | 30.91 | 36.49 |
Gold | SPDR Gold Shares | GLD | -0.73 | -10.01 | 12.04 |
Oil | United States Oil Fund | USO | 22.25 | 86.64 | 61.81 |
US Dollar Index | Invesco DB US Dollar Bullish | UUP | -0.92 | 3.99 | 4.47 |
US Govt Bond (~1-Year) | iShares 1-3 Year Treasury Bond ETF | SHY | 0.13 | 0.72 | 2.99 |
US Govt Bond (~5-Year) | iShares 3-7 Year Treasury Bond ETF | IEI | -0.56 | -0.63 | 2.02 |
US Govt Bond (~10-Year) | iShares 7-10 Year Treasury Bond ETF | IEF | -1.41 | -1.44 | 1.75 |
US Govt Bond (20+ Year) | iShares 20+ Year Treasury Bond ETF | TLT | -4.50 | -3.62 | -1.17 |
VIX | ProShares VIX Short-Term Futures ETF | VIXY | -3.91 | -20.57 | -50.62 |
This material is intended for educational and informational purposes only. It is not intended to provide specific advice or recommendations for any individual. Additionally, you should consult with your Financial Advisor, Tax Advisor, or Attorney on your specific situation. The views expressed in the material are that of the author and do not necessarily reflect those of any market, regulatory body, State or Federal Agency, or Association. All efforts have been made to report or share true and accurate information. However, the information may become materially outdated or otherwise rendered incorrect due to subsequent new research or other changes, without notice. The author nor the firm are able to always verify the content from third-party sources. For additional information about the firm, please visit the MAS Website at https://www.mas.gov.sg/ and the SEC Website at www.adviserinfo.sec.gov. For a copy of the firm's ADV Part 2 Brochure, please contact us at info@avriowealth.com.